|
| |
TM 9-254
8-6.
Waveform Reading - Continued
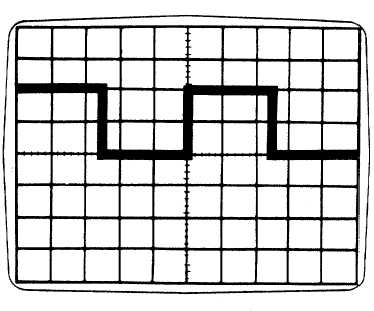
Figure 8-13. Square Waveform Display
(9)
If the waveform shown in figure 8-13 is not exactly 2 divisions or grid squares high, gain of the vertical
amplifier should be adjusted. Use a small screwdriver and adjust the GAIN control (fig. 8-12) for a
waveform exactly 2 divisions high (1 volt peak-to-peak).
(10) The number of divisions or grid squares, that the signal covers in the vertical direction, times the setting
of the VOLTS/DIV switch (fig. 8-12) equals the peak-to-peak voltage amplitude of the input signal.
NOTE
An oscilloscope which has dual trace capability contains two vertical amplifiers, a left and right
vertical amplifier. The right vertical amplifier has the same controls and functions as the left
vertical amplifier.
(11) To use the right input and vertical amplifier, you must depress RIGHT vertical mode (10, fig. 8-8).
c.
Time and Frequency Measurements. The time and frequency of a waveform is always measured along the
horizontal axis of the graduated scale on the face of the CRT.
NOTE
The following steps apply only to time and frequency measurement of waveforms displayed on the
oscilloscope.
8-19
|