|
| |
TRUCK SERVICE MANUAL
TM 5-4210-230-14&P-1
WHEELS, RIMS, TIRES
Overinflation is also costly because a tire which is 20%
overinflated will produce only 92% normal tire mileage.
"Bleeding" of air from hot tires should never be
practiced. The pressure will be reduced but an increase in
temperature will result as soon as driving continues.
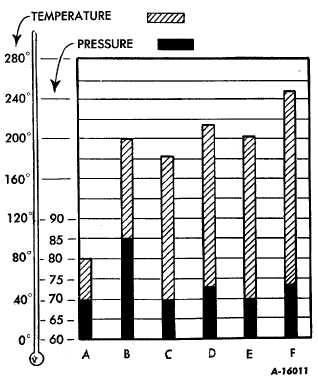
Fig. 11. Chart Showing Effects of Bleeding
The chart (Fig. 11) illustrates a condition where a tire
was started cool with a pressure of 70 pounds and at a
temperature-of 26.7 degrees C (80 degrees F).
A -
Initial conditions.
B -
After 225 km (140 miles) of driving the pressure had
increased to 85 pounds and temperature 93.3
degrees C (200 degrees F).
C -
The pressure was then "bled" to 70 pounds and an
additional drive made of 225 km (140 miles). Note
the temperature.
D -
The pressure had increased to 73 pounds while the
temperature
increased
to
approximately
104.4
degrees C (220 degrees F).
E -
Again
"bleeding"
was
resorted
to.
Note
the
temperature.
F -
After 322 km (200 miles), the tire failed from a
temperature of over 121.1 degrees C (250 degrees
F).
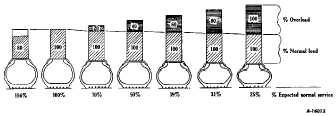
LOADS
Loading tires beyond their rated capacity is expensive
because tire mileages are rapidly decreased with overloads.
The following chart (Fig. 12) illustrates how an overload of
only 20% will result in tire mileage being only 70% of normal.
Fig. 12. Overload vs. Mileage
CTS-2032N Page 5
PRINTED IN UNITED STATES OF AMERICA
|